
 Share
Share
 Print
Print
|
|
|
|
|


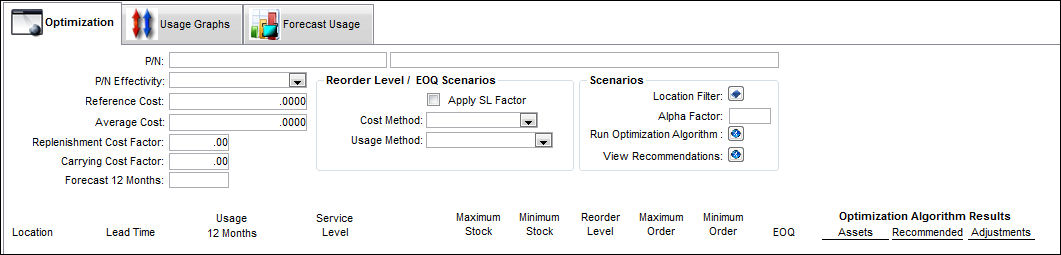
TRAX displays the Inventory Optimization (Expendable) window.
Query:
The following information/options are available in this window:
_____________________________________________________________________________________
P/N
The Part Number reference for the aircraft part.
Only main part numbers can be selected for the optimization.
P/N Effectivity drop down
From the drop down menu, select the A/C - Tail effective to the P/N the optimization is being simulated for.
Reference Cost
The part’s reference cost is used by the reorder formula to determine the EOQ value in the P/N Inventory Levels window. If left blank, the EOQ field that is updated when the P/N Reorder Level is generated will remain "0.00."
This field functions in accordance with the Switch  PNREFCST. If set to Yes, the system will compare the Part Number Reference Cost to the PO unit cost. If there is a difference the user will receive a prompt asking if they would like to update the Part Number Reference Cost (P/N Master, Cost Tab) with the PO Unit Cost.
This information is pulled from the P/N Master, Costing Tab, via the P/N Master of the Settings Training Manual.
Average Cost
The Average Cost of the Part in local currency, which is re-calculated upon receipt of inventory from Purchases, Invoice Adjustments (if there is a difference between PO Price and INV Price), and Return to Stock (which is unknown inventory returned at average cost or credited to the Work Order, differing the P/N Cost from the Average Cost).
The explanation for the formula is as follows:
(The total number of Unit Costs currently in Inventory) / (The total of all quantities currently in inventory). For example, if you have three parts in inventory for a certain P/N (three parts including all possible instances of the part [available in inventory, available for repair etc.]). And the unit costs on each part are $10, $15, and $20 each. If all information has been entered properly, the current Average cost would be calculated as (10 + 15 + $20) / 3) = $15. Expanding on the example, if you receive a new same part at $18, the current Average cost would re-compute as follows: ($10 + $15 + $20 + $18) / (3 + 1) = 15.75.
This information is pulled from the P/N Master, Costing Tab, via the P/N Master of the Settings Training Manual.
Replenishment Cost Factor
The cost of replenishing inventory. The formula for replenishing stock compares forecast stock usage against available stock throughout the coming year. Existing replenishment orders are also considered since these affect future requirement needs.
This information is pulled from the P/N Master, Costing Tab, via the P/N Master of the Settings Training Manual.
Carrying Cost Factor
The Carrying Cost Factor is a percentage that represents the total cost of holding inventory over a period of time (storing, stocking, handling, taxes, insurance, depreciation, etc.) divided by the total value of the inventory. For example, if there is an inventory value of $10,000 and a carrying cost of 20%, then the carrying cost is $2,000. Knowing this percentage can help determine if inventory carrying costs are optimal or if they can be reduced. This field is represented as a percentage, therefore a value of "0.30" would indicate 30%.
This information is pulled from the P/N Master, Costing Tab, via the P/N Master of the Settings Training Manual.
Forecast 12 Months
This value is pulled from the Inventory Optimization (Expendable), Forecast Usage Tab. For additional information, refer to the Inventory Optimization (Expendable), Forecast Usage Tab via Inventory Optimization (Expendable) of the Inventory Training Manual.
_____________________________________________________________________________________
Reorder Level/EOQ Scenarios:
The following information/options are available in this window:
_____________________________________________________________________________________
Apply SL Factor checkbox
Select the Apply Service Level checkbox to apply the Service Level value to the simulation.
Cost Method drop down
Select from one of the following Cost Methods:
- Reference Cost
- Average Cost
Usage Method drop down
Select from one of the following Usage Methods:
- 12 Month Usage
- 12 Month Forecast
_____________________________________________________________________________________
Scenarios:
The following information/options are available in this window:
_____________________________________________________________________________________
Location Filter  button
Select this button to access the Location drop down. Select one or multiple locations to run the simulation for.
Alpha Factor
This number represents the multiple of the initial population size. The larger the population being used, the better the results. However, the larger the population, the longer the algorithm needs to run. Hence, the alpha factor plays an essential role, since a large Alpha Factor = a large population. This defaults to three.
Run Optimization Algorithm  button
Select this button to run the simulation once all criteria has been selected. The simulation can be done multiple times for optimal results. Once the Optimization is complete, the following information box will appear:
View Recommendations button
Select this button to view all recommended transfer order(s) of parts. If there are too many parts in one location, the system will recommend that the user transfer these parts to other locations. Once a location requires more stock, the user may create a requisition for the part.
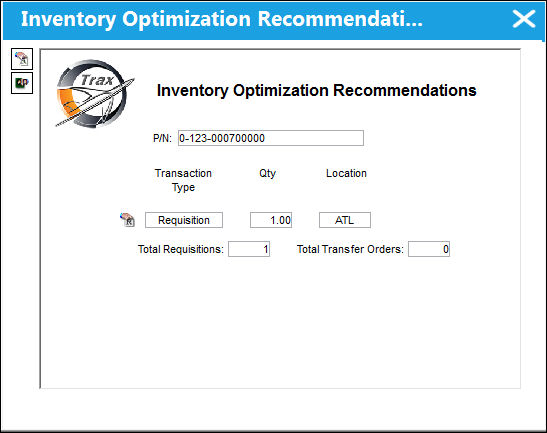
Create Requisitions  button
Select this button to create a requisition for a part based on the recommendation of the Inventory Optimization.
Create Transfer Orders  button
Select this button to create a transfer order based on the recommendation of the Inventory Optimization.
_____________________________________________________________________________________
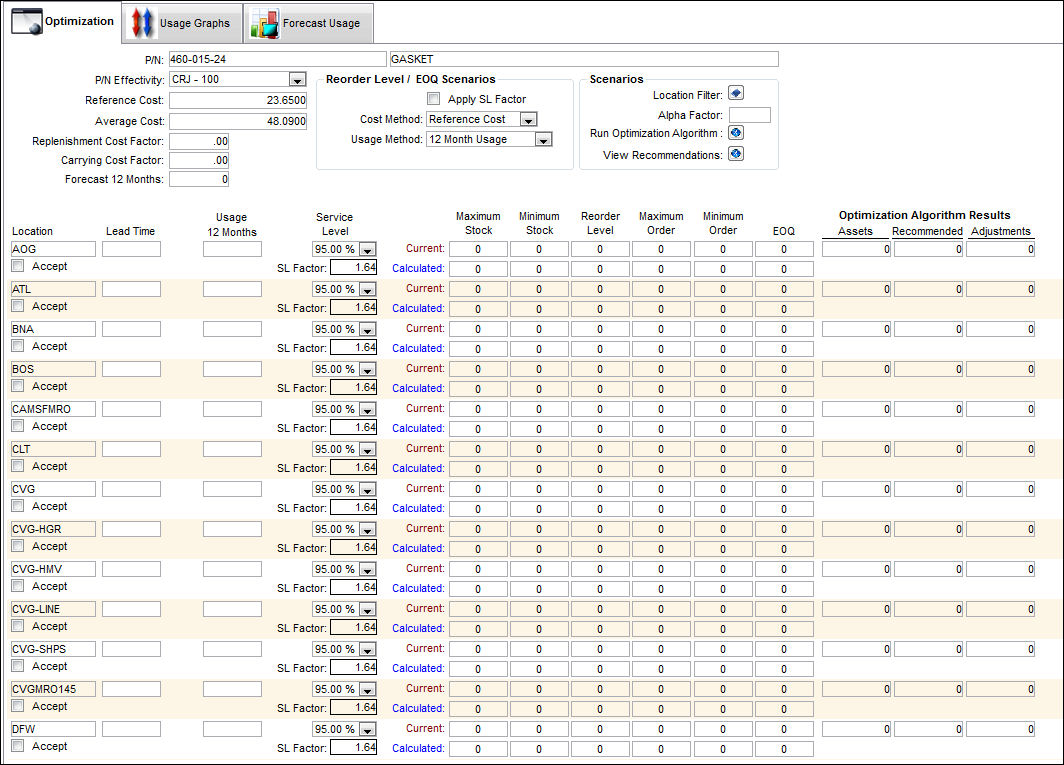
Once a P/N is selected, the results for the simulation are shown below:
Results:
The following information/options are available in this window:
_____________________________________________________________________________________
Location
The Location for maintenance events, inventory stores, orders, transactions, or training events.
Accept checkbox
Select the Accept checkbox to accept the recommended calculations. Select the Save  button to save these values to the Inventory Optimization (Expendable), Optimization tab.
Lead Time
The number of days needed for the delivery of the P/N.
Usage (12 Months)
The number of times the P/N has been used in a 12 month period.
Expendables = Issued P/Ns - Returned P/Ns
Rotables = Issued P/Ns
Service Level
This is the percentage of service the user wants for every request of a P/N.
(i.e. For one particular company, it may be acceptable for a P/N to be available for only 50% of the time, based on their need for that part.)
This value is derived from the following formula:
Service Level = the inverse of the standard normal cumulative distribution. The distribution has a mean of zero and a standard deviation of one.
Maximum Stock
The maximum in stock quantity allowed. This value is derived from the following formula:
Maximum Stock = Reorder Level + Minimum Stock
Minimum Stock
The minimum in stock quantity required (Safety Stock). The minimum stock level can be used to report on items that require urgent action.
Minimum Stock = Reorder Level
Reorder Level
The Re-Order point for the Part. This value is derived from the following formula:
Reorder Level = [ ROUND (Usage / 365) * Lead Time) + if the 'Apply Service Level Factor checkbox' is selected, then the Service Level Factor,0) ,0 ]
Maximum Order
The Maximum Order is the result of the EOQ.
Minimum Order
The Minimum Order is the result of the EOQ.
EOQ
The Economic Order Quantity. This value is derived from the following formula:
EOQ = ROUND [ SQRT 2 * (Cost Method * Usage) * Replenishment Cost Factor) / (Cost Method^2 * Carrying Cost Factor),0 ]
Optimization Algorithm Results Assets
The number of parts required to achieve the Service Level %.
Optimization Algorithm Results Recommended
The number of parts recommended for each location.
Optimization Algorithm Results Adjustments
The number of parts needed to be added or removed to arrive at the Assets Required value.
_____________________________________________________________________________________
Share
Print
|
©1997-2026 Trax USA Corp. All rights reserved. This manual may not be copied, photocopied, reproduced, translated, or converted to any electronic or machine-readable form, in whole or in part, without prior written approval from Trax USA Corp. |
 |