
 Share
Share
 Print
Print
|
|
|
|
|


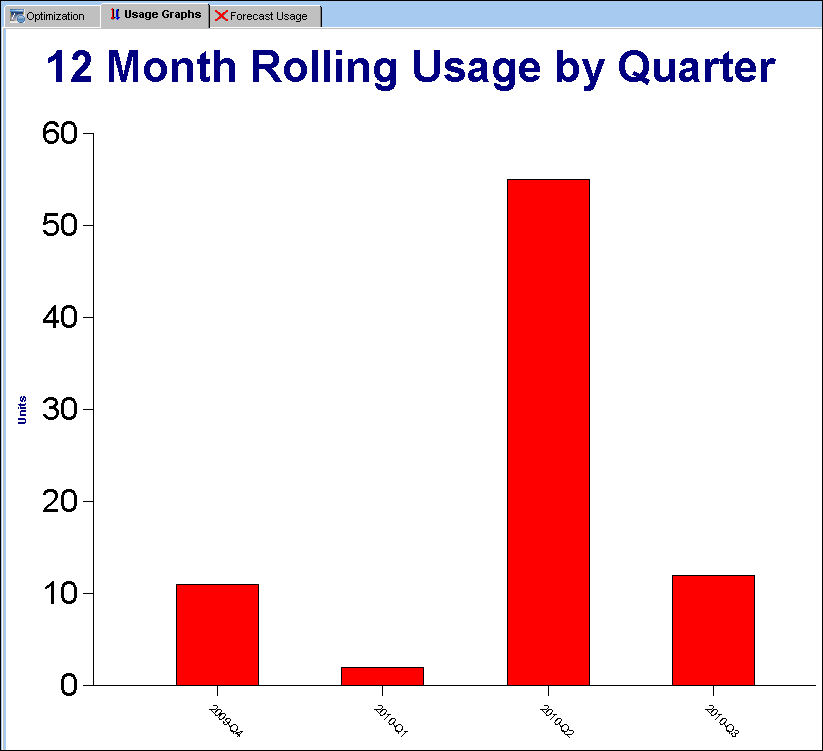
The Inventory Optimization (Expendable), Usage Graphs tab displays a graphical view of part usage by quarter. The user can utilize this information to find out during which quarters a part is used the most or the least.
Share
Print
|
©1997-2026 Trax USA Corp. All rights reserved. This manual may not be copied, photocopied, reproduced, translated, or converted to any electronic or machine-readable form, in whole or in part, without prior written approval from Trax USA Corp. |
 |